Mastering how to measure marketing performance: A Practical Guide
Measuring marketing performance is about one thing: connecting your work to what the business actually cares about—revenue, customer growth, and profit. It's how you stop just doing marketing and start proving its value in the language every executive speaks: numbers.
Why Measuring Performance Defines Your Marketing Career

If you're ready to move from just running campaigns to proving their strategic worth, this is for you. For any marketer with ambition, getting a handle on performance measurement isn't optional. It's the one skill that separates the doers from the strategic leaders.
Think of this guide as your playbook. It's designed to help you connect every blog post, ad campaign, and social media update directly to tangible business results.
We're going to push past the "vanity metrics"—the likes and impressions that feel good but don't mean much. Instead, you'll get a practical framework to demonstrate real, measurable value. This is how you build credibility with leadership, fight for bigger budgets, and build an undeniable case for your next promotion.
The Foundation of a Powerful Measurement System
Building a solid measurement system isn't about hoarding data; it's about telling a convincing story of growth and contribution. This goes way beyond pulling a few numbers from Google Analytics. It's a structured approach built on a few key ideas:
- Strategic KPI Selection: You need to pick metrics that actually reflect business goals, not just the busy work happening in a specific channel.
- Clear Attribution: This means getting a real sense of which touchpoints in a customer's journey are actually the ones that drive them to convert.
- Data-Driven Storytelling: The goal is to build reports and dashboards that deliver insights and tell a story, not just dump a bunch of data points on a slide.
When you get these elements right, you stop looking like a cost center and start looking like a revenue driver. You become the marketer who can confidently answer the tough questions and show exactly how your work hits the bottom line. For an even deeper look, this guide on how to measure marketing effectiveness offers a fantastic overview.
The goal is to transform your marketing data from a rearview mirror into a GPS. It shouldn't just tell you where you've been; it should guide every decision you make moving forward.
This framework sets the stage for everything that follows: choosing the right KPIs, mastering attribution models, and creating reports that get you noticed. Understanding these principles is a core skill for anyone building a career in data-focused roles. For more details on that path, take a look at our guide on how to become a marketing analyst.
Here's a quick look at the core pillars we'll be building on throughout this guide.
Core Pillars of Marketing Performance Measurement
A quick overview of the essential components covered in this guide to build a comprehensive measurement strategy.
| Pillar | What It Means | Why It's Critical for Your Career |
|---|---|---|
| KPIs & Goals | Choosing the right metrics that align directly with business objectives and setting realistic targets. | Proves you're focused on what matters to the business, not just vanity metrics. |
| Attribution | Assigning credit to the marketing touchpoints that influence a conversion. | Helps you justify budget allocation and optimize your channel mix effectively. |
| Data & Tools | Selecting the right technology and processes for collecting, cleaning, and managing your data. | Ensures your insights are built on a foundation of accurate and reliable information. |
| Analysis & Reporting | Turning raw data into actionable insights and presenting them in a clear, compelling story. | This is how you demonstrate your impact, influence strategy, and earn a seat at the table. |
Getting these pillars right is what turns your marketing efforts into a clear, undeniable narrative of success. Now, let's get into the details.
Choosing Marketing KPIs That Actually Matter
Let's get one thing straight: not all marketing metrics are created equal. If you spend your days chasing likes, impressions, and page views without tying them back to real business goals, you're on a fast track to wasting your budget and stalling your career.
The truth is, the most powerful Key Performance Indicators (KPIs) are completely dependent on context. They shift based on your specific role, the channels you manage, and what the company is trying to achieve right now.
A paid media specialist's dashboard, laser-focused on immediate sales, should look nothing like a content marketer’s, who is busy building awareness at the top of the funnel. Trying to slap a one-size-fits-all measurement plan on your marketing is precisely where things fall apart. The real skill is cutting through the noise to find the numbers that prove your contribution to the bottom line.
Aligning KPIs with Business Objectives
Before you even glance at a channel-specific metric, you have to connect your work to the larger company mission. What’s the number one priority this quarter? Is it getting the brand name out there, generating a pipeline of qualified leads, or driving direct sales?
Each of these goals demands a totally different measurement playbook.
- Awareness: If your mission is to introduce the brand to new people, your KPIs need to reflect reach and engagement. You're simply measuring how many people are seeing your message and how they're interacting with it.
- Lead Generation: Here, the game changes from eyeballs to actions. You need to track how well you’re turning anonymous website visitors into actual contacts who have shown interest in what you offer.
- Sales: This is the most direct goal, and your KPIs have to tie straight back to revenue. The objective is to prove that your marketing activities are creating paying customers and a positive return.
A classic mistake is focusing on a vanity metric like impressions when the business is desperate for leads. A campaign that gets millions of views but generates zero leads isn't a success—it's a sign of a misaligned strategy.
Channel-Specific KPIs for Different Marketing Roles
Once you’re locked in on the business objective, you can start drilling down into the metrics that matter for your specific job. A growth marketer juggling multiple channels needs a bird's-eye view, while a specialist managing a single platform needs to get into the weeds.
For the SEO Specialist
An SEO's world is built on organic visibility and traffic quality. Sure, rankings are a piece of the puzzle, but they don't tell the whole story.
- Organic Traffic: The total number of sessions coming from search engines.
- Keyword Rankings (for commercial-intent terms): Tracking your position for keywords that signal someone is ready to buy, not just browse.
- Click-Through Rate (CTR) from SERPs: The percentage of people who see you in the search results and actually click. A high CTR means your titles and descriptions are hitting the mark.
- Lead or Sales Conversions from Organic Traffic: This is the ultimate test. Is your SEO work contributing directly to the business's goals?
For the Paid Media Manager
This role is all about efficiency and return on investment. Every dollar you spend needs to come back with friends.
- Return on Ad Spend (ROAS): This is the holy grail. For every $1 you put into ads, how much revenue are you getting back?
- Cost Per Acquisition (CPA) / Cost Per Lead (CPL): How much does it cost, on average, to get a new customer or a new lead from your paid campaigns?
- Conversion Rate: Of all the people who clicked your ad, what percentage actually did the thing you wanted them to do (like make a purchase or fill out a form)?
- Click-Through Rate (CTR): While it comes second to ROAS and CPA, a strong CTR is a great indicator that your ad creative and targeting are resonating.
Figuring out how to squeeze more out of your ad budget is crucial. Our guide on how to improve marketing ROI is packed with strategies that work hand-in-hand with these KPIs.
A growth marketer lives and dies by the relationship between two key metrics: Customer Acquisition Cost (CAC) and Lifetime Value (LTV). A healthy business model requires that the value a customer brings over their lifetime is significantly greater than the cost to acquire them.
For the Content Marketer
Content marketing is often a long game, focused on building trust and authority over time. The KPIs need to reflect that customer journey.
- Traffic and Engagement: Metrics like time on page, average bounce rate, and scroll depth are fantastic for seeing if people are actually reading and valuing your content.
- Lead Generation: How many Marketing Qualified Leads (MQLs) did that big blog post or new ebook actually generate?
- Assisted Conversions: Content often plays a critical role early in the buying process. This metric shows you how many sales a piece of content influenced, even if it wasn’t the very last thing a customer clicked.
For marketers in the e-commerce world, the KPIs get even more specific. If that's you, checking out this list of 10 Key Ecommerce Performance Metrics can give you some vital ideas for tracking what matters today. Nailing this process of selecting the right metrics is the foundation for proving your value and driving real, meaningful growth.
Setting Baselines and Targets to Show Real Progress
So, you’ve picked out your KPIs. Great. But a number like "1,000 new leads" is meaningless on its own. Is that good? Bad? About average? Without context, your metrics are just numbers floating in a void, and they certainly won't impress anyone in the C-suite.
This is where baselines and targets come in. Think of it like a road trip. Your baseline is your starting point on the map, and your target is the destination. This simple step is what turns a boring data report into a compelling story of growth, proving that your marketing efforts are actually moving the needle.
Establishing Your Performance Baseline
First things first, you need a starting line. Your baseline is the benchmark you’ll measure all future performance against. The most honest place to find this is in your own historical data. Forget what everyone else is doing for a moment and look inward.
Pull up your data from the last three to six months to get a sense of your typical performance. If you’re running content marketing, for instance, you’d look at things like:
- Average monthly organic traffic: What's your normal flow of visitors from search?
- Average leads from blog posts: How many leads does a typical article generate?
- Average time on page for key articles: Are people actually reading what you write?
This internal data is gold because it’s unique to your business, your audience, and your place in the market. It gives you a realistic foundation to build upon.
Your baseline isn't just a number; it's the foundation of your entire performance story. It’s what allows you to confidently say, "We grew by 30% this quarter," and have it mean something significant.
Once you have this internal benchmark, you can start looking outward to see how you stack up.
Using Industry Benchmarks for Greater Context
While your own history is the best starting point, knowing what’s considered “good” in your industry adds a crucial layer of context. It can completely change how you view a campaign’s success. This is especially true for channel-specific metrics where performance varies wildly.
Take Click-Through Rates (CTR), for example. The average CTR across digital ads is all over the map. Search advertising averages around 6.6 percent, while display ads hover closer to a meager 0.6 percent. These industry numbers are critical reference points, but remember they can shift depending on your specific sector and audience. You can dive deeper into these marketing measurement standards to see where you land.
Comparing your numbers to these benchmarks helps you spot your wins and your weaknesses. If your email open rates are double the industry average, that's a huge victory to celebrate and analyze. If your social media engagement is lagging behind competitors, you’ve just found your next big project.
Setting SMART Goals for Your KPIs
Okay, you’ve got your baseline and some industry context. Now it’s time to set some meaningful targets. The best way to do this is with the SMART framework. It’s a classic for a reason—it forces you to create goals that are clear, motivating, and actually tied to business results.
A flimsy goal sounds like this: "Increase website traffic." It's vague and uninspiring.
A SMART goal, on the other hand, sounds like this: "Increase organic website traffic to the blog by 15% (from a baseline of 20,000 to 23,000 monthly visitors) by the end of Q3 by publishing eight new SEO-optimized articles and updating five existing high-potential posts."
See the difference? Let's break it down:
- Specific: It’s not just any traffic; it’s organic traffic to the blog.
- Measurable: The target is a 15% increase, with hard numbers (20,000 to 23,000).
- Achievable: A 15% lift is ambitious but totally possible with the planned actions.
- Relevant: Driving more organic traffic directly supports the larger marketing goal of generating leads.
- Time-bound: There's a clear deadline: "the end of Q3."
When you apply this structure to your core KPIs, you’re not just setting goals; you’re building a roadmap. Everyone on your team knows exactly what they’re aiming for, how they’ll be measured, and when it needs to happen. This is how you demonstrate real, strategic value over and over again.
Mastering Attribution: How to Connect Your Actions to Actual Results
You've got your goals locked in. Now comes the tricky part: figuring out which of your marketing efforts actually earned that conversion. Welcome to the world of marketing attribution—the process of connecting the dots between your campaigns and real customer outcomes.
Without a solid attribution strategy, you're basically flying blind with your budget. Mastering it is how you graduate from "I think this campaign is working" to "I know it's working, and here’s the data to prove it."
It all fits into a simple, powerful flow: you establish a baseline, set a clear goal, and then track your progress against it. Attribution is the engine that powers that final, crucial tracking phase.
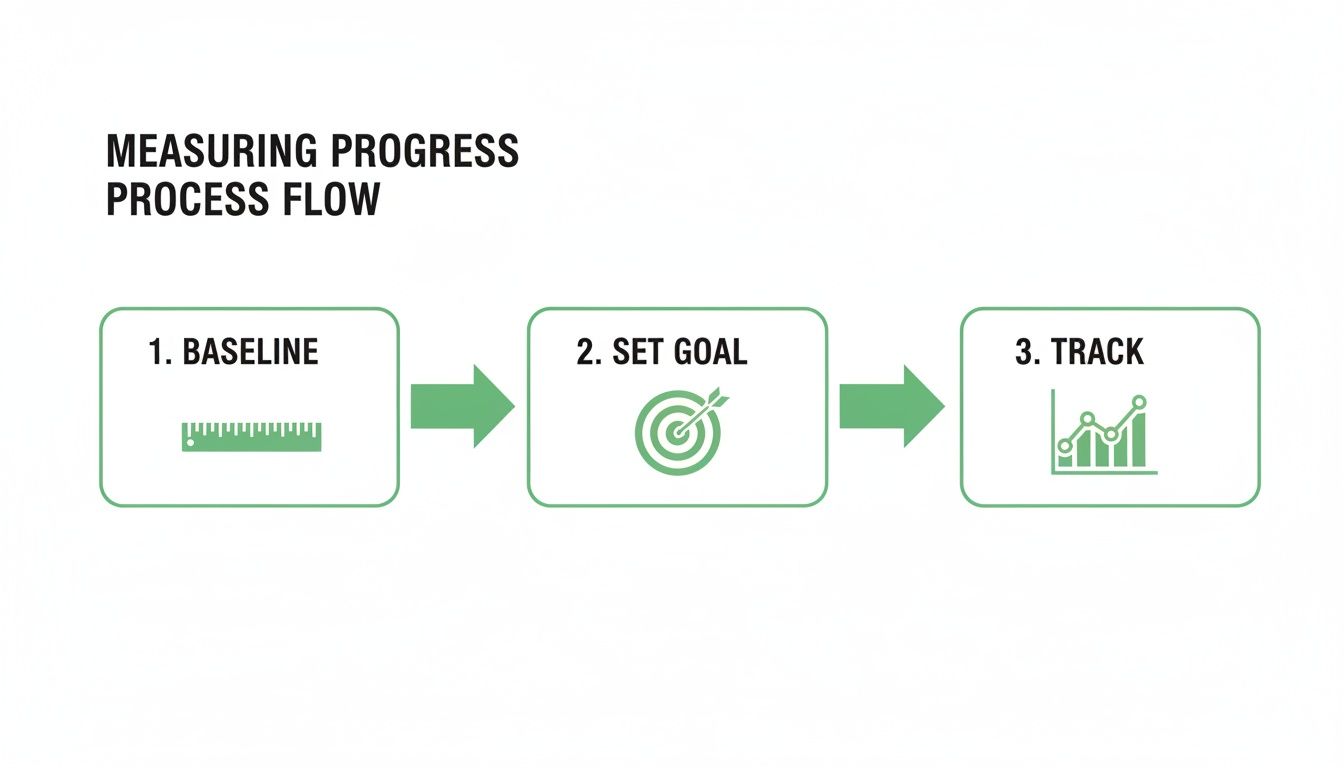
This framework makes it possible to see if your efforts are truly hitting the targets you've set.
From Simple Clicks to the Full Customer Story
Attribution isn't a one-size-fits-all game. Different models tell different stories about the customer journey, and the right one for you depends entirely on your business model, sales cycle, and how complex your marketing mix is.
The most common starting point is Last-Click Attribution. It’s exactly what it sounds like: 100% of the credit for a sale goes to the very last touchpoint a customer had with you. While it's simple and easy to track, it often misses the bigger picture, ignoring all the earlier interactions that built awareness and trust.
To get a more holistic view, you need to look at Multi-Touch Attribution models. These models are designed to distribute credit across multiple touchpoints, giving you a much clearer sense of how all your channels work together to create a customer.
A Closer Look at Multi-Touch Attribution Models
Let's walk through a common scenario. A future customer discovers your brand through a blog post they found on Google. A few days later, they see a retargeting ad on social media and click it. A week after that, they type your brand name directly into Google, navigate to your site, and make a purchase.
How do different models assign credit for that sale?
- Linear: This is the fairest, most straightforward approach. It splits the credit equally across every touchpoint. In our example, the organic search (blog), the social ad, and the final direct search would each get 33.3% of the credit. It’s a great place to start if you believe every interaction has value.
- Time-Decay: This model values recency. It gives more credit to the touchpoints that happened closer to the conversion. So, the final direct search gets the most credit, the social ad gets less, and that first blog post discovery gets the least. This model is really useful for businesses with longer sales cycles where later interactions are often more influential.
- Position-Based (U-Shaped): This hybrid model gives most of the credit to the bookends of the journey: the first touch and the last touch. It typically assigns 40% of the credit to the first interaction and 40% to the final converting click, distributing the remaining 20% across any touchpoints in the middle. It’s perfect for valuing both the initial discovery and the final decision-making step.
For a marketing manager, the choice of attribution model directly impacts how you justify your budget. A Last-Click model might overvalue your paid search efforts while completely ignoring the hard work your content team does to build initial awareness.
Which Attribution Model is Right for Your Business?
There's no single perfect answer here, but some solid principles can guide your decision.
- Short Sales Cycles: If you’re in e-commerce or sell products with a fast path to purchase, a Last-Click or Time-Decay model can often give you the insights you need without overcomplicating things.
- Long Sales Cycles: For B2B companies or anyone selling high-ticket items, a Linear or Position-Based model provides a much more accurate picture of the long, winding road your customers take.
- Data-Driven Attribution: Ready for the big leagues? Tools like Google Analytics 4 offer data-driven models that use machine learning to analyze every path—both converting and non-converting—to figure out which touchpoints are truly the most influential. This is the most sophisticated option, but it requires a ton of data to work well.
At the end of the day, any attribution model should help you optimize your marketing mix and maximize your financial return. That’s why Return on Investment (ROI) has become such a non-negotiable KPI. In fact, marketers who can clearly demonstrate ROI are 1.6 times more likely to get executive buy-in and access to the data they need.
By truly mastering attribution, you're doing more than just tracking clicks; you're proving the financial impact of every single dollar you spend. You can learn more about how to measure marketing performance with ROI and other metrics to round out your understanding.
Building Dashboards and Reports That Tell a Story
Let’s be honest: raw data is just noise. Your meticulously chosen KPIs, attribution models, and baselines mean nothing until you can translate them into a clear, compelling story that actually sparks action. This is where the rubber meets the road—turning messy spreadsheets into clean dashboards and reports that make sense to everyone, from your direct manager to the C-suite.
The real goal isn't just to show numbers on a screen. It's to offer an interpretation. A great report doesn't just state what happened; it explains why it happened and what the team should do about it next. This is how you shift from being seen as a campaign executor to a genuine strategic partner.
Tailoring Your Report to the Audience
The single biggest mistake I see marketers make is creating one-size-fits-all reports. Your CEO and your paid media specialist care about wildly different things, and trying to speak to both with the same document is a recipe for getting ignored.
You have to tailor the story to the audience to make your data stick.
- For the C-Suite: They need the 30,000-foot view, and they need it fast. Focus on the big-picture metrics that directly tie to the bottom line—think Customer Acquisition Cost (CAC), Marketing ROI, and marketing-sourced revenue. Keep it visual, concise, and all about business outcomes.
- For Marketing Leadership: Your boss needs a bit more detail. This is where you show how channel performance contributes to the department's overall goals. You can connect your team's activities to MQLs, SQLs, and pipeline velocity. Highlight the trends you're seeing and be ready to offer strategic recommendations.
- For Channel Specialists: Your peers on the ground need the granular details. This is the place for deep dives into campaign-specific metrics like CTR, CPC, and conversion rates. The focus here is all about tactical optimization and what to do tomorrow to improve performance.
Failing to adjust for your audience is like trying to have the same conversation with three people who speak different languages. It just doesn't work.
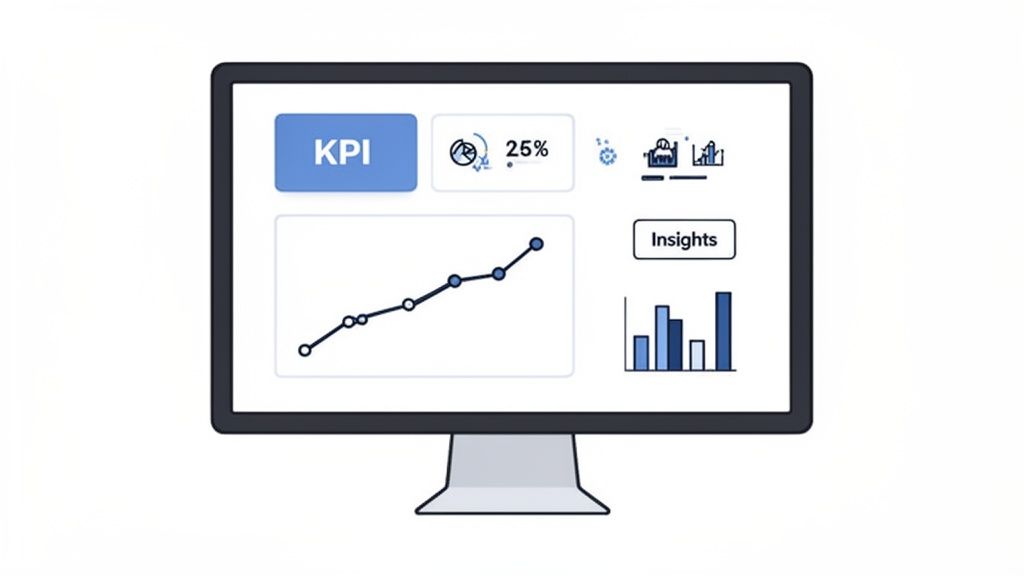
The Anatomy of a Powerful Marketing Dashboard
A well-designed dashboard should give you an at-a-glance view of performance. It makes it easy to spot trends, wins, and problems without having to dig through a single spreadsheet. Whether you're using Google Data Studio, HubSpot, or a more advanced BI tool, the core principles don't change.
Think of your dashboard as a story that moves from the general to the specific.
- The Executive Summary (Top Left): Start with the most important, high-level KPIs. This section should immediately answer the question, "Are we winning or losing?" I always include things like overall lead volume, MQLs, and total marketing-sourced revenue for the period right here.
- Performance Trends (Center): Use line charts to show how you’re doing over time. This visual context is absolutely critical for understanding momentum. Plot your main KPIs against your targets and the previous period—it makes progress (or lack thereof) impossible to miss.
- Channel Deep Dive (Bottom/Right): Now, break down performance by source. Use bar charts or tables to clearly show which channels (Organic Search, Paid Social, Email, etc.) are pulling their weight. This is the section that helps you answer, "What's working best, and where should we put our next dollar?"
Your dashboard should tell a story in 30 seconds. If someone can't grasp the key takeaways almost instantly, the design has failed. Simplicity and clarity always win over cramming in every possible metric.
From Data Points to Actionable Insights
The final piece of the puzzle is the analysis. A report without insights is just a data dump. Your real value as a marketer shines when you connect the dots and provide clear, actionable recommendations rooted in the data you're presenting.
Don't just state the facts. You have to explain the implications.
- Observation (The What): "Organic traffic was down 10% month-over-month."
- Insight (The Why): "This drop lines up perfectly with a known Google algorithm update that impacted rankings for two of our biggest keyword clusters."
- Recommendation (The What's Next): "I recommend we prioritize updating the five blog posts that lost the most traffic and start building a new topic cluster around a more stable, long-tail keyword theme to diversify our risk."
This approach shows you're not just a reporter; you're a proactive problem-solver. It’s also a key part of building a more efficient team. For those looking to take this a step further, exploring marketing workflow automation can free up time to focus more on this kind of strategic analysis. By framing your findings this way, you reinforce your value and prove you know how to measure marketing performance to drive real business growth.
Of course. Here is the rewritten section, designed to sound like it was written by an experienced marketing professional.
Your Top Questions About Measuring Marketing Performance, Answered
Even with the best framework, a few questions always come up when you start getting serious about measuring marketing. It’s completely normal. Shifting from "gut feeling" to data-backed decisions is a major change, but working through these early hurdles is how you build real confidence in your strategy.
Let’s tackle some of the most common questions I hear from marketers. My goal here is to give you quick, practical answers to cut through the confusion and help you move forward.
We Have Zero Measurement in Place. Where on Earth Do We Start?
Starting from a blank slate can feel paralyzing, but I actually see it as a huge advantage. You get to build a clean, focused system without dealing with years of messy data or outdated processes. The trick is to start small and be incredibly specific. Please, don't try to measure everything at once.
First, pick one core business objective you can rally around. Just one. For example, maybe your goal is to "generate 50 marketing-qualified leads (MQLs) per month from our blog." That single, clear goal is your North Star.
Now, choose just three to five KPIs that directly measure your progress toward that goal. For our MQL example, you’d want to track:
- Marketing Qualified Leads (MQLs): The ultimate outcome.
- Cost Per Lead (CPL): Are we getting these leads efficiently?
- Organic Traffic to Blog: The top-of-funnel fuel for our leads.
- Blog Lead Conversion Rate: How well is the blog turning visitors into actual leads?
With your KPIs chosen, make sure you have the basic tools in place. This usually just means getting Google Analytics set up with goals configured correctly. From there, just let it run. Your only job for the next 30 to 60 days is to establish a baseline. That initial data becomes the benchmark you’ll measure everything against.
How Often Should We Be Looking at and Reporting on Performance?
There's no single right answer here. The ideal reporting cadence depends entirely on who you're talking to and what they need to know. A one-size-fits-all report usually ends up being noise for everyone.
Think of it in tiers. For the people in the trenches running campaigns—especially on paid channels—daily or at least weekly check-ins are a must. This is how you catch a failing ad before it burns through your budget or double down on a winner while it's hot.
For your direct manager or the rest of the marketing team, a bi-weekly or monthly report usually hits the sweet spot. It’s frequent enough to spot meaningful trends and have strategic conversations about what’s working, but not so frequent that you're getting lost in minor daily blips.
And for the executive team? A monthly or quarterly report is best. They don’t need the nitty-gritty details. They want the big picture, so focus on bottom-line metrics like ROI, Customer Acquisition Cost (CAC), and how marketing is directly contributing to revenue.
I always tell my team to think of reporting like different camera lenses. Use a microscope for daily tactical tweaks, a standard lens for monthly team strategy, and a wide-angle lens for quarterly executive updates.
Which Attribution Model Is the "Best"?
This is the million-dollar question, isn't it? The honest answer is that there’s no single "best" model that works for every business. The right one for you depends almost entirely on how long and complicated your customer journey is.
If you have a short sales cycle—think most e-commerce shops—a Last-Touch model is often good enough. When someone sees an ad and buys within a few hours, that last click really did do most of the work.
But for almost any B2B company or anyone selling a high-ticket item, a Multi-Touch model is essential. These models are the only way to give proper credit to the blog post someone read three months ago or the webinar they attended last month.
Here’s a quick cheat sheet for picking a starting point:
| Business Type | Recommended Starting Model | Why It Works Well |
|---|---|---|
| E-commerce / B2C | Time-Decay | Gives more credit to recent touchpoints, which are often the most influential in a quick purchase. |
| B2B / High-Value Sales | Linear or Position-Based | Values the entire journey, recognizing that both the first discovery and the final touchpoints are critical. |
| Data-Rich Organizations | Data-Driven | The most accurate option, it uses machine learning to assign credit based on your actual customer behavior. |
If you’re just graduating from Last-Touch, I’d highly recommend starting with a Linear model. It’s simple to explain to stakeholders and immediately starts showing the value of every single marketing channel. As you get more comfortable, you can explore more sophisticated models that paint an even clearer picture.
At SalaryGuide, we believe that understanding your performance is the first step toward proving your value and advancing your career. Our platform is designed to give marketers the tools and data they need to grow, from transparent salary insights to real job opportunities sourced directly from top companies. Take control of your career path today.
