Mastering Time to Hire Metrics for Faster Hiring

When someone talks about "Time to Hire," they're really talking about speed from the candidate's point of view. It’s the total number of days that pass from the moment a candidate applies for a job to the day they officially accept your offer. Think of it as your recruiting team's speedometer—it tells you how fast you're moving and is a dead giveaway for your efficiency and the candidate's experience.
What Is Time to Hire and Why Does It Matter?
Picture your hiring process as a racetrack where the best candidates are the trophy. Time to hire is your lap time. A faster time means you get to the finish line—a signed offer letter—long before your competitors even have a chance to get in the race. A slow, sluggish process just gives them an open invitation to swoop in and steal your best prospects.
This metric is a vital sign for the health of your entire recruiting function. It’s not just about being fast for the sake of being fast. It's about building a process that's so smooth and engaging that great candidates don't have time to second-guess their decision or look at other options. A low time to hire is almost always a direct result of a great candidate experience, clear communication, and a decisive hiring team.
The Key Difference from Time to Fill
It's really easy to mix up time to hire with its close cousin, time to fill. They sound similar, but they measure two completely different parts of the recruiting journey.
- Time to Hire: This is all about the candidate. It kicks off the second they enter your pipeline (by hitting "submit" on their application) and stops the clock when they accept your offer. It’s a pure measure of how efficiently you engage with and evaluate people.
- Time to Fill: This one is all about your internal process. It starts way earlier, on the day a job requisition is officially approved, and only ends when the candidate accepts the offer. This metric tracks the entire internal journey, from getting approvals to sourcing candidates.
A long time to fill could mean it took weeks to get the job req approved, while a long time to hire points straight to bottlenecks in your interview scheduling or decision-making stages. You really need to track both to get the full picture of how well your hiring engine is performing.
A slow hiring process doesn't just frustrate candidates; it actively costs you talent. Every extra day is another chance for your top choice to accept an offer from a company that moves faster.
The global average time to hire has stretched to 44 days, a significant jump that shows just how complex recruiting has become. This long timeline is a major headache for companies, especially in fast-moving industries where hiring delays mean lost opportunities and a real hit to your competitive advantage. You can explore more about these hiring trends and what they mean for businesses today.
How to Accurately Calculate Hiring Speed Metrics
Ready to turn raw dates from your Applicant Tracking System (ATS) into real, actionable insights? Calculating your hiring speed gives you a clear, honest look at how fast your recruiting process really moves. It's not just about speed for speed's sake; it's about understanding where the friction is.
This guide will walk you through the three core metrics you need to know: Time to Hire, Time to Fill, and Time to Accept. We'll cover the exact formulas, so you know precisely which dates to pull from your system and what each number is telling you.
Here’s a quick overview of the story each metric tells:
- Time to Hire tracks the candidate's journey, showing how efficiently you move someone from their initial application to a signed offer. Think of it as the candidate's experience timeline.
- Time to Fill gives you the bigger picture, revealing how internal processes—like getting a job requisition approved or sourcing candidates—impact your overall hiring cycle. This is your internal efficiency score.
- Time to Accept zooms in on that critical final step, measuring the time a candidate takes to decide once they have your offer in hand.
Recruitment Timing Metrics Formula Sheet
To get started, you need to know exactly what to measure. This table breaks down the simple math behind each key hiring metric, defining the precise start and end points for your calculations.
| Metric | Formula (Start Date to End Date) | What It Measures |
|---|---|---|
| Time to Hire | Offer Accepted Date - Application Date | The speed of the candidate's journey from applying to accepting the job. |
| Time to Fill | Offer Accepted Date - Requisition Approval Date | The entire pipeline's efficiency, from the moment a role is approved to when it's filled. |
| Time to Accept | Offer Accepted Date - Offer Sent Date | The candidate's decision-making window after receiving an offer. |
Having these distinct formulas is crucial because they help you isolate different parts of your hiring funnel. A slow Time to Fill might not be the recruiters' fault; it could be a bottleneck in approvals. A long Time to Hire, however, points directly to the interview and evaluation stages.
Key Calculations and Data Points
Each metric answers a specific business question and requires precise timestamps from your ATS.
Time to Hire
- Business Question: Are we moving qualified candidates through our interview process smoothly, or are they getting stuck somewhere?
- Data Points:
application_date,offer_accepted_date
Time to Fill
- Business Question: Is our internal workflow—from approvals to sourcing—creating delays before we even speak to a candidate?
- Data Points:
requisition_approved_at,offer_accepted_date
Time to Accept
- Business Question: How long do candidates take to decide on our offer? Are we competitive enough for them to say yes quickly?
- Data Points:
offer_sent_date,offer_accepted_date
This structured approach helps you focus your improvement efforts where they'll have the biggest impact.
Putting the Formulas to Work: Some Examples
Let's see how this works in the real world.
Imagine a candidate applies for a role on June 1 and accepts your offer on June 20. Your Time to Hire is 19 days. That’s how long it took your team to screen, interview, and land that specific person.
Now, let's say the job requisition for that same role was approved way back on May 15. Since the offer was accepted on June 20, your Time to Fill is 36 days. This shows the full timeline, including the time it took to source candidates before that June 1 application even came in.
Finally, what if you sent the offer on June 17 and they accepted on June 20? Your Time to Accept is a brisk 3 days. A short window like this often signals a strong offer, a great candidate experience, or a highly motivated applicant.
Improving one of these metrics usually requires targeted tactics. For instance, speeding up internal approvals directly helps lower your Time to Fill, while optimizing interview scheduling and feedback loops will reduce your Time to Hire.
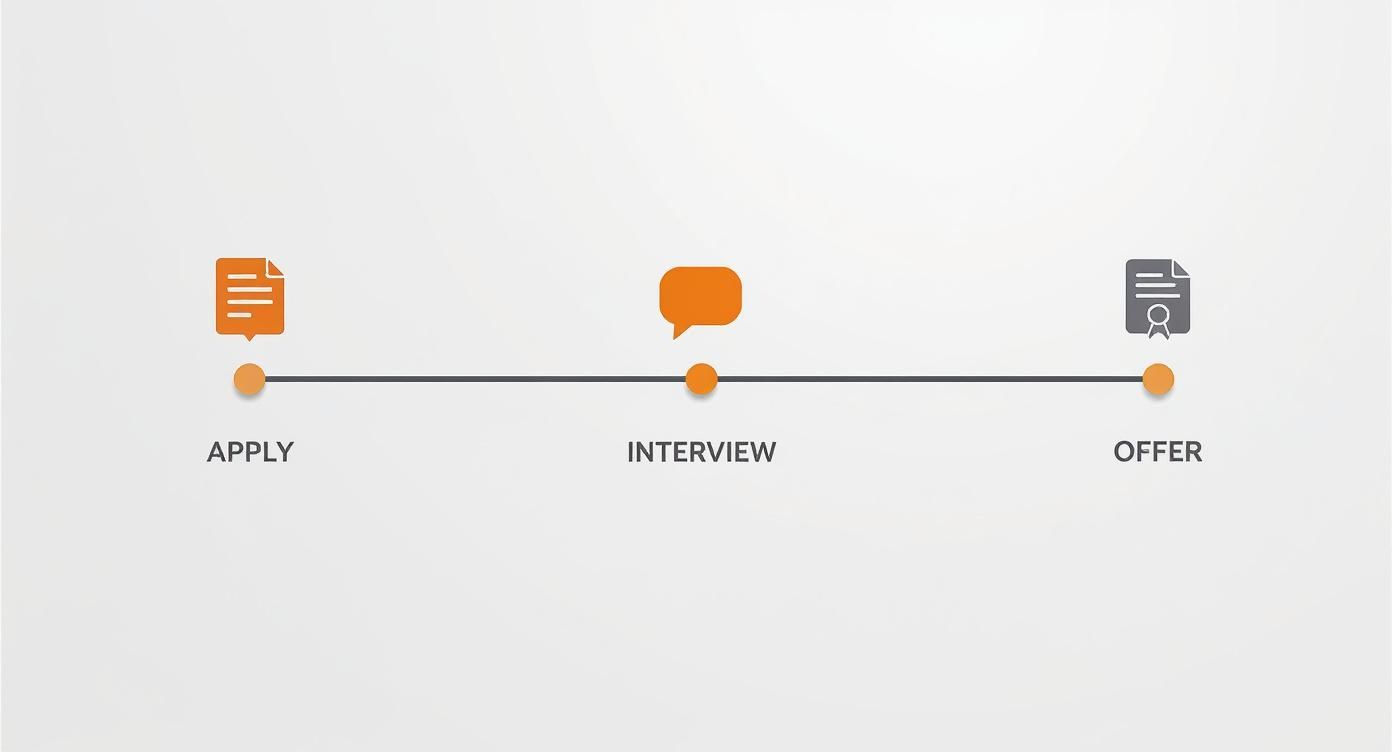
As the infographic shows, the hiring process is a series of stages. Delays at any point—whether it's screening, interviewing, or the offer stage—add up and can risk losing top candidates to competitors. By tracking each metric, you can pinpoint exactly which handoff or stage is adding the most days to your timeline.
Pulling the Right Data from Your ATS
Garbage in, garbage out. Accurate metrics depend entirely on clean, reliable data. You'll need to pull specific timestamped events from your ATS. Look for tables and fields like these:
applications.created_atfor the initial application date.requisitions.approved_atfor when the role was officially opened.offers.sent_atandoffers.accepted_atfor the offer timeline.
For those comfortable with SQL, a query to pull this data might look something like this:
SELECT apps.id AS candidate_id, DATEDIFF(offers.accepted_at, apps.created_at) AS time_to_hire, DATEDIFF(offers.accepted_at, req.approved_at) AS time_to_fill, DATEDIFF(offers.accepted_at, offers.sent_at) AS time_to_accept FROM applications apps JOIN offers ON offers.application_id = apps.id JOIN requisitions req ON apps.requisition_id = req.id;
Insight: Clean and consistent timestamp fields are the foundation of reliable recruiting metrics. If your data is messy, your insights will be, too.
Once you have the raw numbers, don't stop there. Segment your data by department, role, or candidate source to uncover hidden trends. For example, you might find that engineering roles take 20% longer to fill than marketing roles, or that candidates sourced from referrals have a much shorter Time to Hire.
Visualizing Your Metrics to Drive Action
Calculations are one thing; making them useful is another. The best way to track your progress is to feed this data into a dashboard. Key things to visualize include:
- Trends Over Time: Are you getting faster or slower each quarter?
- Averages vs. Medians: Averages can be skewed by a few very long hiring cycles. Medians often give a more realistic picture of the typical experience.
- Breakdowns by Recruiter or Role: Who are your most efficient recruiters? Which departments have the biggest bottlenecks?
Use line charts to track your velocity over time and bar charts to compare performance across different roles. You can even set up alerts to notify you when the Time to Hire for a critical role spikes above your target threshold.
Best Practices for Keeping Your Data Clean
To ensure your metrics remain trustworthy, you have to maintain your data.
- Regularly audit your timestamp fields to catch missing or incorrect data.
- Automate your data pipelines as much as possible to reduce the risk of human error during manual entry.
For even more power, you can connect your ATS to SalaryGuide’s APIs for automated data refreshes and live benchmarking. This keeps your hiring metrics in sync with the market, flagging any potential issues before they become major problems.
Start tracking today. Accurate metrics are the first step toward building a faster, fairer, and more predictable hiring engine. Measure what matters, make targeted improvements, and start winning the race for top talent.
Benchmarking Your Time to Hire Against the Industry
Line up your time to hire metrics with industry norms and you suddenly see the race. It’s like moving from a treadmill to a running track—you need to know where you stand. Benchmarks translate raw data into clear direction.
Each marketing role runs in its own lane. Digital Marketing Managers, SEO Specialists and Content Strategists all move at different paces. Matching your metrics to these lanes shines a light on realistic targets and hidden slow spots.
Industry Benchmarks For Marketing Roles
- Digital Marketing Manager: 35–50 days at mid-size tech firms
- SEO Specialist: 30–45 days, thanks to constant demand for organic growth
- Content Strategist: 28–42 days, influenced by seniority and niche expertise
Be mindful that region, level of experience and competition will push these ranges up or down. In high-pressure markets like San Francisco, you might tack on 10–15 days. Meanwhile, remote-friendly setups can tap broader talent pools and speed things up.
“Your hiring speed depends on both your outreach engine and your decision engine.”
Factors That Influence Hire Timelines
Digging into these benchmarks means understanding what drives them. Treat each factor as a gear in your recruitment engine:
- Industry Demand
Spikes in e-commerce or SaaS often stretch timelines by weeks. - Seniority Level
Executive-level jobs add rounds of interviews and stakeholder checks. - Location
On-site vs. remote impacts scheduling, visa steps and negotiation time.
How To Use Benchmarks For Goal Setting
Once you’ve got your industry numbers, it’s about setting realistic yet motivating targets. Aim to shift from the median into the top quartile—often a 7–10 day improvement across key roles.
- Compare your current averages against these benchmarks by role and region.
- Pinpoint where you lag: screening, interviews or offer stages usually reveal the bottleneck.
- Assign deadlines for each phase and share them with everyone involved.
- Celebrate wins, review quarterly and refine your approach to keep improving.
Check out our guide on competitive salaries to align pay with speed and attract top talent: Competitive Salary Guide.
Imagine a mid-size B2B agency in Chicago. Their time to hire for SEO specialists sat at 55 days, compared to the 30–45 day target. By automating calendar invites, they cut that figure by 20% in just three months.
Segmenting Benchmarks By Region
Geography shapes expectations. A New York City agency often clocks 45 days for marketing hires because of extra interview rounds. Remote roles can wrap up in 25 days thanks to flexible scheduling across time zones.
Adjusting For Seniority Levels
Junior positions typically land in 25–35 days. Manager and director roles stretch longer, given the need for more stakeholder input. Factor these differences into your SLAs to keep hiring targets realistic.
Visualizing Benchmarks In Dashboards
Turning numbers into visuals drives action. Plot your time to hire against benchmark bands on a line chart. Use shaded zones to highlight when you slip past your target. These visual cues help you catch delays before they spiral.
Tracking and comparing these metrics swaps guesswork for data-driven hiring plans—and measurable speed gains. Benchmark today.
Building A Dashboard To Track Hiring Metrics
Numbers alone won’t move the needle unless you can read their story. A dashboard is like a cockpit display for your recruiting process—showing time to hire at a glance. You’ll spot patterns, catch slowdowns, and make course corrections before great candidates slip away.
• Line Charts: Track trends over time
• Bar Charts: Compare departments side by side
• Tables: Display cohort comparisons for deeper analysis
Choosing Visual Components
Start simple. A line chart makes it obvious if your time to hire is shrinking or stretching week by week.
Then add a bar chart to highlight which team or recruiter is the fastest.
• X-axis: Dates, Y-axis: Days to hire
• Color-code quarters for quick visual cues
• Overlay median and average lines for context
A well-designed dashboard turns raw data into targeted hiring actions.
Applying Cohort Analysis
Cohorts let you group hires by period or process tweak. For instance, pit Q1 against Q2 to see if a new scheduling practice saved 10 days on average. Side-by-side cohorts reveal process gains in a blink.
SELECT cohort, AVG(time_to_hire) AS avg_days FROM hiring_data GROUP BY cohort;
Using Segmentation
Breaking data into slices—by recruiter, source, or seniority—uncovers hidden bottlenecks.
• Recruiter Performance: Identify top performers
• Source Channel: Referrals vs. job boards
• Seniority Level: Junior vs. senior roles
Overlay color-coded bars to compare. If Recruiter A averages 25 days while Recruiter B sits at 40 days, you know exactly where to dig in.
- Filter by role (e.g., content strategists) to spot slow points.
- Filter by location to catch time-zone or visa delays.
Building Dashboard Best Practices
Automate your data pulls from ATS or HRIS—no manual exports. To get the right inputs, review the essential Applicant Tracking System features.
If compensation is on your radar, explore our guide on 12 best compensation management software.
Use real-time dashboards so you see changes as they happen. Then:
| Chart Type | Purpose | Tip |
|---|---|---|
| Line Chart | Trend Over Time | Include median lines |
| Bar Chart | Compare Groups | Assign distinct colors |
| Table | Detailed Values | Highlight outliers |
Every dashboard should end with clear action items—linking insights right back to your hiring playbook.
Integrating SalaryGuide Data
Bring live benchmarks into your view to keep targets realistic. SalaryGuide’s API can return median time to hire by role, so you know how you measure up in the market.
GET https://api.salaryguide.com/v1/benchmarks?role=SEO%20Specialist Authorization: Bearer YOUR_API_KEY
Then:
• Schedule daily data refresh jobs
• Store benchmarks separately for historical trends
• Flag any drift beyond 10% as a red flag
Setting Up Dashboard Alerts
Alerts are your safety net for unexpected spikes. Configure triggers when time to hire crosses a critical threshold—say 40 days.
- Define custom thresholds per role.
- Send notifications via webhook to Slack or email.
- Review alerts weekly and tweak your process.
Visual Storytelling With Highlights
Think of color bands as a traffic light for your metrics.
Green: On target
Yellow: Caution zone
Red: Urgent intervention
Effective dashboards don’t just show you data—they tell you exactly where to focus.
Don’t forget a monthly review meeting to turn dashboard insights into recruiter to-dos.
Customizing SalaryGuide Queries
Dial in on specific segments by appending filters. For instance, add &location=Remote to pull remote benchmarks only. This fine-tuning ensures every chart reflects the precise market context for your roles.
Happy dashboard building!
Actionable Strategies To Reduce Your Time To Hire

Finding new hires faster starts with a clear view of where your process stalls. A lengthy recruitment journey not only risks losing top talent but chips away at your employer reputation. Let’s jump into hands-on steps you can roll out right away.
Evaluate Hiring Bottlenecks
Begin by charting every stage in your hiring funnel. Next, pinpoint the choke points—unclear job specs, slow approvals or last-minute interview no-shows. Turning assumptions into data gives you a concrete action plan.
- Vague Job Descriptions: Candidates can’t self-assess, leading to more screening rounds.
- Interview Cancellations: Each reschedule adds days to your cycle.
- Hiring Manager Delays: Waiting on feedback can consume up to 30% of the total timeline.
“Every interview cancellation adds a day to your average time to hire.”
Refine Your Job Descriptions
A sharp, well-crafted posting speaks directly to the right people. Use bullet points and plain language to outline essential skills and team culture. This clarity trims out unfit candidates early.
- Emphasize core responsibilities so candidates know what success looks like.
- Specify required technical skills and years of experience.
- Add a quick team snapshot to showcase your workplace vibe.
Accelerate Interview Scheduling
A smooth calendar flow cuts down idle gaps between stages. Block dedicated interview slots or group similar sessions together. That way, you keep the process moving.
- Link team calendars for instant availability.
- Enable candidate self-scheduling to reduce back-and-forth.
- Automate reminders and follow-ups to lower no-show rates.
Centralize Communication
Scattered email threads lead to missed messages and slowdowns. Instead, bring every candidate interaction into one platform or a dedicated chat channel. Stakeholders stay in sync, and candidates appreciate the prompt updates.
- Create role-specific channels for organized feedback.
- Share interviewer notes as soon as they’re ready.
- Tag team members with @mentions to speed up decisions.
A recent survey found 60% of companies saw their time-to-hire increase over the past year. Interview cancellations, reschedules and manager delays topped the list of culprits. For more detail, dive into the full Playroll research.
Use AI And Automation
To see how technology can cut days off each stage, explore how AI recruitment reduces time to hire. In practice, automation can:
- Parse resumes against preset criteria, filtering out unqualified candidates.
- Auto-trigger interview invites once applicants hit key milestones.
- Generate offer letters and follow-up emails instantly.
Leverage Talent Pipelines
Keeping a ready-made bench of pre-screened candidates gives you a jumpstart when roles open. Nurture this pool with periodic check-ins and targeted content. You’ll engage known talent before posting externally.
- Tag profiles by skill set within your ATS.
- Send quarterly updates to maintain interest.
- Offer referral bonuses to tap into your team’s networks.
Improve Feedback Loops
Fast decisions depend on structured interviewer input. Aim to collect ratings within 24 hours, using scorecards that weigh critical criteria. This method keeps discussions concise and objective.
| Stage | Ideal Turnaround | Tool Tip |
|---|---|---|
| Resume Screening | 1–2 days | Pre-defined AI filters |
| Final Decision | 24 hours | Auto-reminders for feedback |
Pairing a streamlined hiring process with strong retention tactics gives you a real edge. Check out our guide on best employee retention strategies to see how faster hiring connects to long-term engagement.
Measure Impact And Iterate
Data should guide your next moves. Track each tweak’s effect on your weekly time-to-hire, compare before-and-after snapshots, and refine your process one experiment at a time.
- Set baseline metrics for every phase.
- Test one change at a time to isolate impact.
- Document successes and scale what works.
Protect Your Employer Brand
A cumbersome process can sour candidate experiences and spark negative reviews on platforms like Glassdoor. A lean timeline shows respect for people’s time—and protects your reputation.
- Share clear timelines at the application stage.
- Offer constructive feedback, even to those you don’t hire.
- Deliver a warm welcome toolkit once an offer is signed.
Case Study: A B2B agency cut time to hire by 20% by combining self-scheduling and AI screening.
Follow this roadmap in sequence, review your metrics monthly, and double down on successful tactics. Integrate these approaches with SalaryGuide’s APIs to benchmark your hiring cycle. See detailed API docs for examples today.
Common Questions About Time to Hire Metrics
When teams dig into time to hire metrics, they often hit the same roadblocks. Everyone wants straightforward insights without jargon.
“Tracking time to hire helps teams spot delays and make faster hires.”
What Defines Time To Hire And Related Metrics
Think of time to hire as the clock running from when a candidate applies to the moment they accept your offer. It shines a light on how swiftly your process moves.
Time to fill covers the whole requisition lifecycle—from approval to acceptance—while time to offer measures the gap between sending an offer and getting it signed.
- Formula Overview
- Time to Hire = Offer Accepted Date – Application Date
- Time to Fill = Offer Accepted Date – Requisition Approval Date
- Time to Offer = Offer Accepted Date – Offer Sent Date
Where To Pull Data For Accurate Tracking
Your ATS is the go-to source for reliable timestamps like applications.created_at and offers.accepted_at.
You can extract these with SQL or via REST APIs if you’re integrating with SalaryGuide.
Example SQL Snippet
SELECT
DATEDIFF(offers.accepted_at, apps.created_at) AS time_to_hire
FROM applications apps
JOIN offers ON offers.application_id = apps.id;
What Benchmarks Should I Use For Marketing Roles
Anchoring your goals in real-world data keeps expectations grounded. Here’s a quick glance at typical ranges:
| Role | Benchmark Range | Notes |
|---|---|---|
| Digital Marketing Manager | 35–50 days | Mid-size tech companies |
| SEO Specialist | 30–45 days | High demand for organic talent |
| Content Strategist | 28–42 days | Seniority and niche influence |
Remember: region, seniority and industry demand will shift these numbers.
How To Visualize And Act On Time To Hire Metrics
Dashboards turn raw figures into clear action items.
- Line charts reveal hiring trends over time
- Cohort views compare process tweaks before and after
- Segmentation by recruiter, source or role highlights bottlenecks
Then, try these tactics to speed things up:
- Automate interview scheduling to eliminate back-and-forth
- Use standardized scorecards for quicker feedback
- Set alerts when metrics stray beyond targets
- Run cohort analyses to uncover hidden slow points
Key Insight
Trimming 10 days off your time to hire can boost offer acceptance rates significantly.
What Common Pitfalls Should I Avoid
Neglecting data audits is a fast track to misleading metrics. Inconsistent timestamps or missing fields will skew your picture.
Always compare like with like—by department, level or source—to keep insights accurate.
How Often Should Teams Review Metrics
Consistency is key:
- Weekly checks surface sudden scheduling issues
- Monthly reviews track shifting averages and medians
- Quarterly deep dives align metrics with strategic goals
Who Benefits From Tracking Time To Hire
A clear metric benefits everyone:
- Recruiters spot where candidates stall
- Hiring managers see which approvals are slow
- Executives get data for headcount planning
- Candidates enjoy a faster, more transparent process
Integration Notes For SalaryGuide Users
Leverage the SalaryGuide API to pull benchmark data straight into your dashboards.
Use the endpoint:
GET https://api.salaryguide.com/v1/benchmarks?role={role}&location={location}&seniority={level}
Include your Authorization header and swap in the right parameters.
Expert Tip
Align your internal time to hire figures with market benchmarks to stay competitive.
How To Share Metrics With Your Team
Transparency builds alignment. Include time to hire in your weekly recruitment sync:
- Present top-line averages first
- Call out improvements and red flags
- Assign clear follow-up actions
One small agency started sharing weekly charts and cut their hiring cycle by 15% in two months.
Complementary Metrics To Track
Pair time to hire with these indicators for a full picture:
- Quality of hire scores to ensure speed doesn’t sacrifice fit
- Cost per hire to balance budget with velocity
- Candidate satisfaction ratings for experience insights
- Offer acceptance rate to gauge market appeal
Ready to master your hiring speed? Try SalaryGuide for real-time benchmarks and seamless integration. Visit salaryguide.com to get started.
